Web Server Statistics for zalents.ac-hosting19.com

Program started on Sat, Oct 31 2020 at 6:15 AM.
Analyzed requests from Fri, Jul 10 2020 at 3:25 AM to Sat, Oct 31 2020 at 6:13 AM (113.12 days).

General Summary

(Go To: Top | General Summary | Monthly Report | Daily Summary | Hourly Summary | Domain Report | Organization Report | Redirected Referrer Report | Failed Referrer Report | Referring Site Report | Browser Report | Browser Summary | Operating System Report | Status Code Report | File Size Report | File Type Report | Directory Report | Request Report)

Figures in parentheses refer to the 7-day period ending Oct 31 2020 at 6:15 AM.

Successful requests: 4,990 (45)
Average successful requests per day: 44 (6)
Failed requests: 189 (0)
Redirected requests: 7,718 (56)
Distinct files requested: 201 (5)
Distinct hosts served: 63 (3)
Data transferred: 4.14 megabytes (1.18 megabytes)
Average data transferred per day: 37.44 kilobytes (172.46 kilobytes)

Monthly Report

(Go To: Top | General Summary | Monthly Report | Daily Summary | Hourly Summary | Domain Report | Organization Report | Redirected Referrer Report | Failed Referrer Report | Referring Site Report | Browser Report | Browser Summary | Operating System Report | Status Code Report | File Size Report | File Type Report | Directory Report | Request Report)

Each unit (+) represents 1 request for a page.
month#reqs#pages 
Jul 202040
Aug 202040
Sep 20206630
Oct 202043190

Busiest month: Jul 2020 (0 requests for pages).

Daily Summary

(Go To: Top | General Summary | Monthly Report | Daily Summary | Hourly Summary | Domain Report | Organization Report | Redirected Referrer Report | Failed Referrer Report | Referring Site Report | Browser Report | Browser Summary | Operating System Report | Status Code Report | File Size Report | File Type Report | Directory Report | Request Report)

Each unit (+) represents 1 request for a page.
day#reqs#pages 
Sun10320
Mon10320
Tue13690
Wed1410
Thu1400
Fri4550
Sat8210

Hourly Summary

(Go To: Top | General Summary | Monthly Report | Daily Summary | Hourly Summary | Domain Report | Organization Report | Redirected Referrer Report | Failed Referrer Report | Referring Site Report | Browser Report | Browser Summary | Operating System Report | Status Code Report | File Size Report | File Type Report | Directory Report | Request Report)

Each unit (+) represents 1 request for a page.

hour#reqs#pages 
0830
1110
2120
33120
43650
51040
63590
72160
85030
9360
10240
11250
12240
13210
143640
15200
166820
17230
183540
19500
209900
213770
22170
23180

Domain Report

(Go To: Top | General Summary | Monthly Report | Daily Summary | Hourly Summary | Domain Report | Organization Report | Redirected Referrer Report | Failed Referrer Report | Referring Site Report | Browser Report | Browser Summary | Operating System Report | Status Code Report | File Size Report | File Type Report | Directory Report | Request Report)

Listing domains, sorted by the amount of traffic.

#reqs%bytesdomain
4990100%[unresolved numerical addresses]

Organization Report

(Go To: Top | General Summary | Monthly Report | Daily Summary | Hourly Summary | Domain Report | Organization Report | Redirected Referrer Report | Failed Referrer Report | Referring Site Report | Browser Report | Browser Summary | Operating System Report | Status Code Report | File Size Report | File Type Report | Directory Report | Request Report)

Listing the top 20 organizations by the number of requests, sorted by the number of requests.

#reqs%bytesorganization
2009 9.53%3
1002 4.76%62.151
999 4.75%103
327 3.01%45
189 0.03%162.241
124 1.15%81.24
121 1.12%137.117
70 0.87%91
61 0.57%195.201
1410.90%217.160
843.54%66.249
813.87%13
8 0.07%185.220
5 0.01%34
5 0.05%51
5 0.01%66.133
4 0.01%18
4 3.99%23
3 0.02%95
3 144.91
21 1.73%[not listed: 17 organizations]

Redirected Referrer Report

(Go To: Top | General Summary | Monthly Report | Daily Summary | Hourly Summary | Domain Report | Organization Report | Redirected Referrer Report | Failed Referrer Report | Referring Site Report | Browser Report | Browser Summary | Operating System Report | Status Code Report | File Size Report | File Type Report | Directory Report | Request Report)

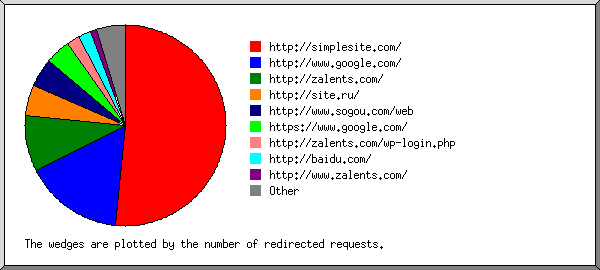
Listing referring URLs, sorted by the number of redirected requests.

#reqsURL
104http://www.google.com/
79http://site.ru/
40http://www.sogou.com/web
40  http://www.sogou.com/web?query=site:www.zalents.com
35http://zalents.com/
17http://www.zalents.com/
8http://baidu.com/
4http://zalents.com//
4https://www.netcraft.com/survey/
3https://builtwith.com/
3https://sucuri.net/
2http://zalents.com/wp-content/plugins/wp-file-manager/lib/files/feoidasf4e0_index.php
2http://zalents.com/wp-json/wp/v2/users
1http://zalents.com/wp-content/themes/dfd-native/assets/js/plugins.min.js
1http://www.dreams-works.net/profile/24299093/view/
1http://zalents.com/wp-content/plugins/seo-watcher/ofc/php-ofc-library/ofc_upload_image.php
1http://zalents.com/zalents.com/wp-content/uploads/redux/options.css
1http://search.aol.com/aol/search
1http://www.mildredhome.top/blog/24299093/view/
1http://jswtv.space/
1http://zalents.com/wp-content/plugins/whatsmyrank-devenc/php-ofc-library/ofc_upload_image.php
1http://www.google.com.hk/
1http://www.swrh.net/blog/24299093/tips-to-get-organic-traffic-to-your-website/
1https://zalents.com/alfa.php
1http://zalents.com/js/common.js
1http://zalents.com/wp-content/plugins/invit0r/lib/php-ofc-library/ofc_upload_image.php
1https://zalents.com/wso.php
1https://www.google.com/url/
1https://zalents.com/wp-content/themes/sketch/404.php
1http://www.popelina.com/profile/24299093/view/

Failed Referrer Report

(Go To: Top | General Summary | Monthly Report | Daily Summary | Hourly Summary | Domain Report | Organization Report | Redirected Referrer Report | Failed Referrer Report | Referring Site Report | Browser Report | Browser Summary | Operating System Report | Status Code Report | File Size Report | File Type Report | Directory Report | Request Report)

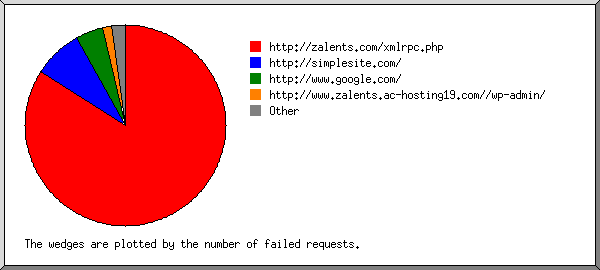
Listing referring URLs, sorted by the number of failed requests.

#reqsURL
2http://www.zalents.ac-hosting19.com//wp-admin/
1http://zalents.com//wp-admin/
1http://zalents.com/wp-admin/
1http://www.zalents.com//wp-admin/

Referring Site Report

(Go To: Top | General Summary | Monthly Report | Daily Summary | Hourly Summary | Domain Report | Organization Report | Redirected Referrer Report | Failed Referrer Report | Referring Site Report | Browser Report | Browser Summary | Operating System Report | Status Code Report | File Size Report | File Type Report | Directory Report | Request Report)

Listing referring sites, sorted by the number of requests.

#reqssite
173http://zalents.com/

Browser Report

(Go To: Top | General Summary | Monthly Report | Daily Summary | Hourly Summary | Domain Report | Organization Report | Redirected Referrer Report | Failed Referrer Report | Referring Site Report | Browser Report | Browser Summary | Operating System Report | Status Code Report | File Size Report | File Type Report | Directory Report | Request Report)

Listing browsers with at least 1 request for a page, sorted by the number of requests for pages.

#reqs#pagesbrowser
49900[not listed: 54 browsers]

Browser Summary

(Go To: Top | General Summary | Monthly Report | Daily Summary | Hourly Summary | Domain Report | Organization Report | Redirected Referrer Report | Failed Referrer Report | Referring Site Report | Browser Report | Browser Summary | Operating System Report | Status Code Report | File Size Report | File Type Report | Directory Report | Request Report)

Listing browsers with at least 1 request for a page, sorted by the number of requests for pages.

##reqs#pagesbrowser
 49900[not listed: 10 browsers]

Operating System Report

(Go To: Top | General Summary | Monthly Report | Daily Summary | Hourly Summary | Domain Report | Organization Report | Redirected Referrer Report | Failed Referrer Report | Referring Site Report | Browser Report | Browser Summary | Operating System Report | Status Code Report | File Size Report | File Type Report | Directory Report | Request Report)

Listing operating systems, sorted by the number of requests for pages.

##reqs#pagesOS
13520Unix
 3520  Linux
260Known robots
32350OS unknown
45840Macintosh
538130Windows
 31330  Windows NT
 6800  Unknown Windows

Status Code Report

(Go To: Top | General Summary | Monthly Report | Daily Summary | Hourly Summary | Domain Report | Organization Report | Redirected Referrer Report | Failed Referrer Report | Referring Site Report | Browser Report | Browser Summary | Operating System Report | Status Code Report | File Size Report | File Type Report | Directory Report | Request Report)

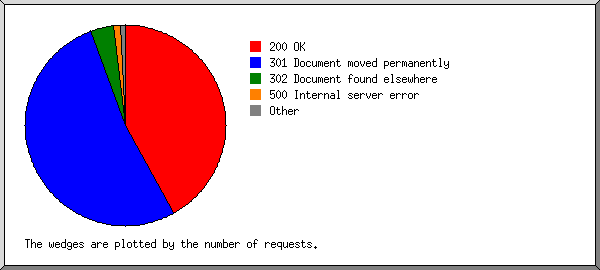
Listing status codes, sorted numerically.

#reqsstatus code
4990200 OK
7604301 Document moved permanently
114302 Document found elsewhere
27400 Bad request
15405 Method not allowed
147500 Internal server error

File Size Report

(Go To: Top | General Summary | Monthly Report | Daily Summary | Hourly Summary | Domain Report | Organization Report | Redirected Referrer Report | Failed Referrer Report | Referring Site Report | Browser Report | Browser Summary | Operating System Report | Status Code Report | File Size Report | File Type Report | Directory Report | Request Report)

size#reqs%bytes
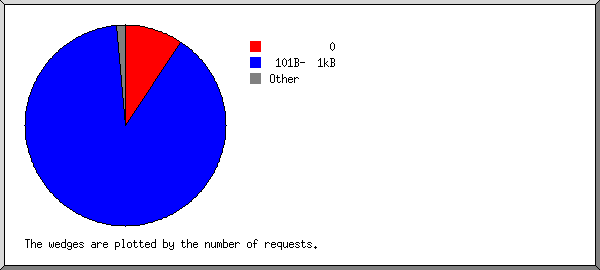
0178 
1B- 10B0 
11B- 100B47 0.09%
101B- 1kB473425.79%
1kB- 10kB2 0.05%
10kB-100kB2630.58%
100kB- 1MB343.50%

File Type Report

(Go To: Top | General Summary | Monthly Report | Daily Summary | Hourly Summary | Domain Report | Organization Report | Redirected Referrer Report | Failed Referrer Report | Referring Site Report | Browser Report | Browser Summary | Operating System Report | Status Code Report | File Size Report | File Type Report | Directory Report | Request Report)

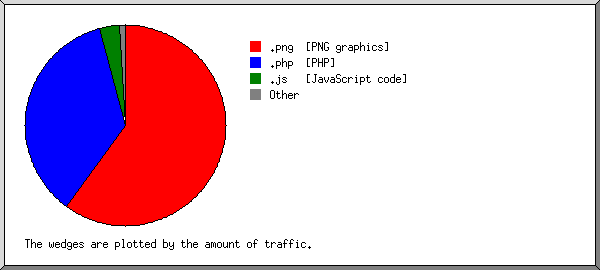
Listing extensions with at least 0.1% of the traffic, sorted by the amount of traffic.

#reqs%bytesextension
491243.84%.php [PHP]
343.50%.png [PNG graphics]
1612.46%.js [JavaScript code]
10 0.10%.xml
49 0.09%[not listed: 3 extensions]

Directory Report

(Go To: Top | General Summary | Monthly Report | Daily Summary | Hourly Summary | Domain Report | Organization Report | Redirected Referrer Report | Failed Referrer Report | Referring Site Report | Browser Report | Browser Summary | Operating System Report | Status Code Report | File Size Report | File Type Report | Directory Report | Request Report)

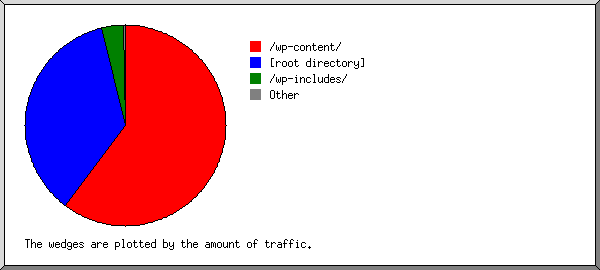
Listing directories with at least 0.01% of the traffic, sorted by the amount of traffic.

#reqs%bytesdirectory
491943.90%[root directory]
343.50%/wp-content/
1812.51%/wp-includes/
47 0.09%/.well-known/
3 [not listed: 1 directory]

Request Report

(Go To: Top | General Summary | Monthly Report | Daily Summary | Hourly Summary | Domain Report | Organization Report | Redirected Referrer Report | Failed Referrer Report | Referring Site Report | Browser Report | Browser Summary | Operating System Report | Status Code Report | File Size Report | File Type Report | Directory Report | Request Report)

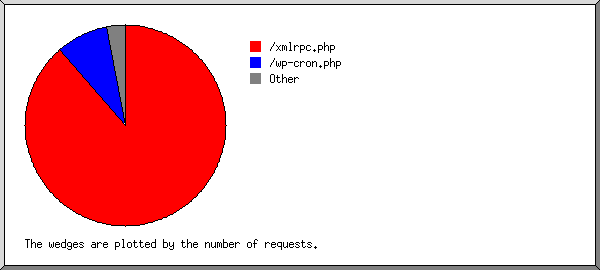
Listing files with at least 20 requests, sorted by the number of requests.

#reqs%byteslast timefile
473643.84%Oct/30/20 8:24 AM/xmlrpc.php
173 Oct/31/20 4:43 AM/wp-cron.php
8156.16%Oct/31/20 4:42 AM[not listed: 23 files]