Web Server Statistics for zalents.ac-hosting19.com

Program started on Mon, Nov 30 2020 at 5:00 AM.
Analyzed requests from Fri, Jul 10 2020 at 3:25 AM to Mon, Nov 30 2020 at 4:37 AM (143.05 days).

General Summary

(Go To: Top | General Summary | Monthly Report | Daily Summary | Hourly Summary | Domain Report | Organization Report | Redirected Referrer Report | Failed Referrer Report | Referring Site Report | Browser Report | Browser Summary | Operating System Report | Status Code Report | File Size Report | File Type Report | Directory Report | Request Report)

Figures in parentheses refer to the 7-day period ending Nov 30 2020 at 5:00 AM.

Successful requests: 12,390 (32)
Average successful requests per day: 86 (4)
Failed requests: 200 (0)
Redirected requests: 8,966 (53)
Distinct files requested: 316 (3)
Distinct hosts served: 117 (2)
Data transferred: 7.82 megabytes (5.12 kilobytes)
Average data transferred per day: 55.97 kilobytes (748 bytes)

Monthly Report

(Go To: Top | General Summary | Monthly Report | Daily Summary | Hourly Summary | Domain Report | Organization Report | Redirected Referrer Report | Failed Referrer Report | Referring Site Report | Browser Report | Browser Summary | Operating System Report | Status Code Report | File Size Report | File Type Report | Directory Report | Request Report)

Each unit (+) represents 1 request for a page.
month#reqs#pages 
Jul 202040
Aug 202040
Sep 20206630
Oct 202043200
Nov 202073990

Busiest month: Jul 2020 (0 requests for pages).

Daily Summary

(Go To: Top | General Summary | Monthly Report | Daily Summary | Hourly Summary | Domain Report | Organization Report | Redirected Referrer Report | Failed Referrer Report | Referring Site Report | Browser Report | Browser Summary | Operating System Report | Status Code Report | File Size Report | File Type Report | Directory Report | Request Report)

Each unit (+) represents 1 request for a page.
day#reqs#pages 
Sun82350
Mon11110
Tue13930
Wed1620
Thu1640
Fri4820
Sat8430

Hourly Summary

(Go To: Top | General Summary | Monthly Report | Daily Summary | Hourly Summary | Domain Report | Organization Report | Redirected Referrer Report | Failed Referrer Report | Referring Site Report | Browser Report | Browser Summary | Operating System Report | Status Code Report | File Size Report | File Type Report | Directory Report | Request Report)

Each unit (+) represents 1 request for a page.

hour#reqs#pages 
0850
1230
2200
33140
43670
51080
63650
72200
89770
936620
1031770
11320
12360
13270
143770
15260
166890
17290
183620
19560
2010000
213890
22250
23240

Domain Report

(Go To: Top | General Summary | Monthly Report | Daily Summary | Hourly Summary | Domain Report | Organization Report | Redirected Referrer Report | Failed Referrer Report | Referring Site Report | Browser Report | Browser Summary | Operating System Report | Status Code Report | File Size Report | File Type Report | Directory Report | Request Report)

Listing domains, sorted by the amount of traffic.

#reqs%bytesdomain
12390100%[unresolved numerical addresses]

Organization Report

(Go To: Top | General Summary | Monthly Report | Daily Summary | Hourly Summary | Domain Report | Organization Report | Redirected Referrer Report | Failed Referrer Report | Referring Site Report | Browser Report | Browser Summary | Operating System Report | Status Code Report | File Size Report | File Type Report | Directory Report | Request Report)

Listing the top 20 organizations by the number of requests, sorted by the number of requests.

#reqs%bytesorganization
717042.90%148.72
2009 5.04%3
1002 2.52%62.151
999 2.51%103
332 1.62%45
299 0.01%162.241
134 0.93%91
124 0.61%81.24
121 0.59%137.117
61 0.30%195.201
22 0.11%185.220
14 5.77%217.160
1223.09%66.249
10 0.05%51
8 7.33%13
6 0.02%95
5 0.01%34
5 0.01%66.133
4 18
4 2.11%23
49 4.47%[not listed: 34 organizations]

Redirected Referrer Report

(Go To: Top | General Summary | Monthly Report | Daily Summary | Hourly Summary | Domain Report | Organization Report | Redirected Referrer Report | Failed Referrer Report | Referring Site Report | Browser Report | Browser Summary | Operating System Report | Status Code Report | File Size Report | File Type Report | Directory Report | Request Report)

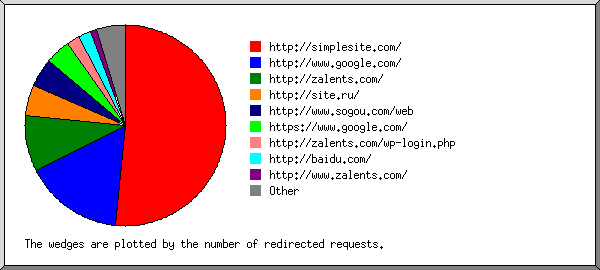
Listing the top 30 referring URLs by the number of redirected requests, sorted by the number of redirected requests.

#reqsURL
132http://www.google.com/
79http://site.ru/
51http://www.sogou.com/web
51  http://www.sogou.com/web?query=site:www.zalents.com
48http://zalents.com/
18http://www.zalents.com/
10http://baidu.com/
7http://zalents.com/wp-content/plugins/wp-file-manager/lib/php/connector.minimal.php
7https://www.google.com/
5https://www.netcraft.com/survey/
4http://zalents.com//
3https://builtwith.com/
3https://sucuri.net/
2https://zalents.com/wp-content/themes/sketch/wp-ajax24.php
2http://zalents.com/wp-content/plugins/wp-file-manager/lib/files/feoidasf4e0_index.php
2http://zalents.com/wp-json/wp/v2/users
1http://zalents.com/wp-content/themes/dfd-native/assets/js/plugins.min.js
1http://www.dreams-works.net/profile/24299093/view/
1http://zalents.com/wp-content/plugins/seo-watcher/ofc/php-ofc-library/ofc_upload_image.php
1http://zalents.com/zalents.com/wp-content/uploads/redux/options.css
1http://search.aol.com/aol/search
1https://zalents.com/shell.php
1http://www.mildredhome.top/blog/24299093/view/
1http://zalents.com/wp-login.php
1http://jswtv.space/
1http://zalents.com/wp-content/plugins/whatsmyrank-devenc/php-ofc-library/ofc_upload_image.php
1https://zalents.com/wp-content/plugins/hello.php
1http://www.google.com.hk/
1http://mail.zalents.com/
1http://www.swrh.net/blog/24299093/tips-to-get-organic-traffic-to-your-website/
1https://zalents.com/alfa.php
6[not listed: 6 URLs]

Failed Referrer Report

(Go To: Top | General Summary | Monthly Report | Daily Summary | Hourly Summary | Domain Report | Organization Report | Redirected Referrer Report | Failed Referrer Report | Referring Site Report | Browser Report | Browser Summary | Operating System Report | Status Code Report | File Size Report | File Type Report | Directory Report | Request Report)

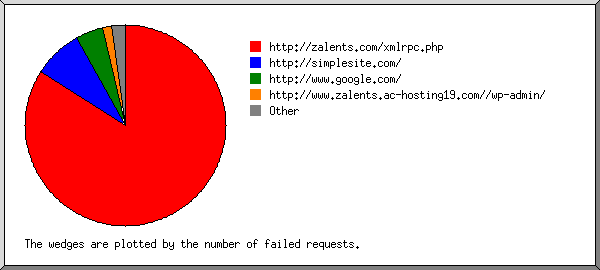
Listing referring URLs, sorted by the number of failed requests.

#reqsURL
2http://www.zalents.ac-hosting19.com//wp-admin/
1http://zalents.com//wp-admin/
1http://zalents.com/wp-admin/
1http://www.zalents.com//wp-admin/

Referring Site Report

(Go To: Top | General Summary | Monthly Report | Daily Summary | Hourly Summary | Domain Report | Organization Report | Redirected Referrer Report | Failed Referrer Report | Referring Site Report | Browser Report | Browser Summary | Operating System Report | Status Code Report | File Size Report | File Type Report | Directory Report | Request Report)

Listing referring sites, sorted by the number of requests.

#reqssite
284http://zalents.com/

Browser Report

(Go To: Top | General Summary | Monthly Report | Daily Summary | Hourly Summary | Domain Report | Organization Report | Redirected Referrer Report | Failed Referrer Report | Referring Site Report | Browser Report | Browser Summary | Operating System Report | Status Code Report | File Size Report | File Type Report | Directory Report | Request Report)

Listing browsers with at least 1 request for a page, sorted by the number of requests for pages.

#reqs#pagesbrowser
123900[not listed: 78 browsers]

Browser Summary

(Go To: Top | General Summary | Monthly Report | Daily Summary | Hourly Summary | Domain Report | Organization Report | Redirected Referrer Report | Failed Referrer Report | Referring Site Report | Browser Report | Browser Summary | Operating System Report | Status Code Report | File Size Report | File Type Report | Directory Report | Request Report)

Listing browsers with at least 1 request for a page, sorted by the number of requests for pages.

##reqs#pagesbrowser
 123900[not listed: 14 browsers]

Operating System Report

(Go To: Top | General Summary | Monthly Report | Daily Summary | Hourly Summary | Domain Report | Organization Report | Redirected Referrer Report | Failed Referrer Report | Referring Site Report | Browser Report | Browser Summary | Operating System Report | Status Code Report | File Size Report | File Type Report | Directory Report | Request Report)

Listing operating systems, sorted by the number of requests for pages.

##reqs#pagesOS
13630Unix
 3630  Linux
2110Known robots
33510OS unknown
46020Macintosh
5110630Windows
 103690  Windows NT
 6940  Unknown Windows

Status Code Report

(Go To: Top | General Summary | Monthly Report | Daily Summary | Hourly Summary | Domain Report | Organization Report | Redirected Referrer Report | Failed Referrer Report | Referring Site Report | Browser Report | Browser Summary | Operating System Report | Status Code Report | File Size Report | File Type Report | Directory Report | Request Report)

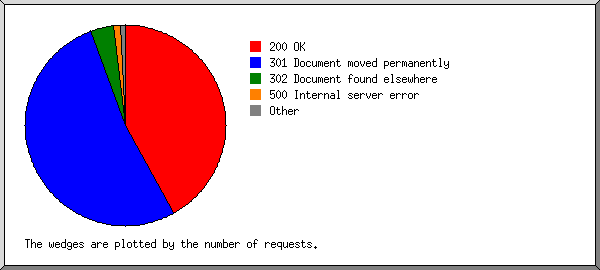
Listing status codes, sorted numerically.

#reqsstatus code
12389200 OK
8792301 Document moved permanently
174302 Document found elsewhere
1304 Not modified since last retrieval
36400 Bad request
17405 Method not allowed
147500 Internal server error

File Size Report

(Go To: Top | General Summary | Monthly Report | Daily Summary | Hourly Summary | Domain Report | Organization Report | Redirected Referrer Report | Failed Referrer Report | Referring Site Report | Browser Report | Browser Summary | Operating System Report | Status Code Report | File Size Report | File Type Report | Directory Report | Request Report)

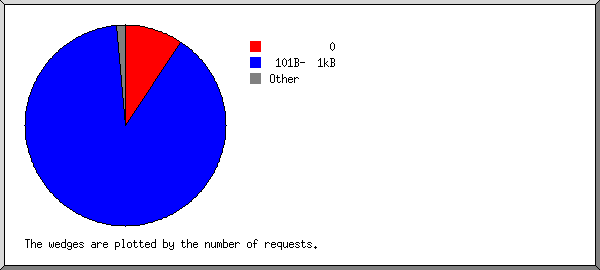
size#reqs%bytes
0290 
1B- 10B0 
11B- 100B47 0.05%
101B- 1kB1201149.24%
1kB- 10kB5 0.18%
10kB-100kB2716.33%
100kB- 1MB1034.21%

File Type Report

(Go To: Top | General Summary | Monthly Report | Daily Summary | Hourly Summary | Domain Report | Organization Report | Redirected Referrer Report | Failed Referrer Report | Referring Site Report | Browser Report | Browser Summary | Operating System Report | Status Code Report | File Size Report | File Type Report | Directory Report | Request Report)

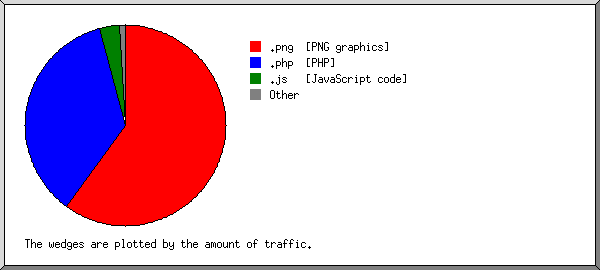
Listing extensions with at least 0.1% of the traffic, sorted by the amount of traffic.

#reqs%bytesextension
1230366.80%.php [PHP]
626.41%.png [PNG graphics]
16 6.59%.js [JavaScript code]
65 0.20%[not listed: 5 extensions]

Directory Report

(Go To: Top | General Summary | Monthly Report | Daily Summary | Hourly Summary | Domain Report | Organization Report | Redirected Referrer Report | Failed Referrer Report | Referring Site Report | Browser Report | Browser Summary | Operating System Report | Status Code Report | File Size Report | File Type Report | Directory Report | Request Report)

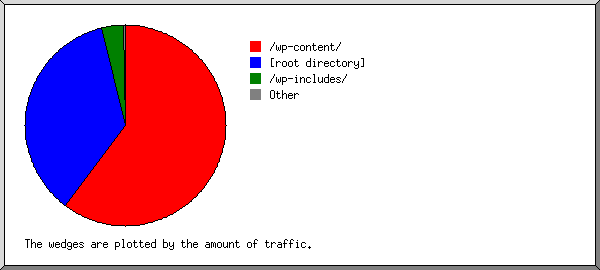
Listing directories with at least 0.01% of the traffic, sorted by the amount of traffic.

#reqs%bytesdirectory
1231366.83%[root directory]
726.49%/wp-content/
18 6.62%/wp-includes/
47 0.05%/.well-known/
5 0.02%/wp-admin/

Request Report

(Go To: Top | General Summary | Monthly Report | Daily Summary | Hourly Summary | Domain Report | Organization Report | Redirected Referrer Report | Failed Referrer Report | Referring Site Report | Browser Report | Browser Summary | Operating System Report | Status Code Report | File Size Report | File Type Report | Directory Report | Request Report)

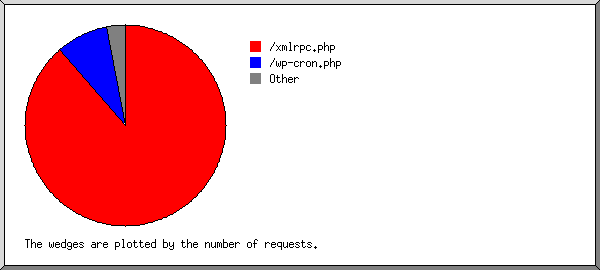
Listing files with at least 20 requests, sorted by the number of requests.

#reqs%byteslast timefile
1201566.78%Nov/29/20 3:28 PM/xmlrpc.php
283 Nov/29/20 2:52 PM/wp-cron.php
9233.22%Nov/24/20 5:57 PM[not listed: 28 files]